Mathematics Visualizations for Machine Learning: A Visual Learning Guide
Understand machine learning math through visualization. Linear algebra, calculus, and neural network concepts explained with visual intuition.

Make AI images and video in your browser
Characters, video, photo packs. No GPU, no setup. Your first generation is free.
I failed calculus the first time I took it. The symbols were meaningless. Then I discovered Grant Sanderson's 3Blue1Brown videos, and suddenly, math clicked. The difference? Visualization. When I saw what a derivative actually meant geometrically, the formulas made sense. This guide brings that approach to machine learning mathematics.
Quick Answer: Machine learning math becomes intuitive when visualized. Vectors as arrows, matrices as transformations, gradients as slopes, and neural networks as function compositions. This visual foundation makes understanding architectures, debugging models, and intuiting improvements dramatically easier.
- Vectors: Think arrows with direction and magnitude
- Matrices: Visualize as transformations that stretch, rotate, or squeeze space
- Gradients: Picture as slopes pointing toward steepest ascent
- Neural networks: See as layered transformations of data
- Backpropagation: Visualize as gradient flowing backward through layers
Why Visual Mathematics Matters for ML
Here's a controversial opinion: you don't need to be a math expert to understand machine learning. You need geometric intuition. The formulas are tools, but the understanding comes from seeing what those formulas do.
When you visualize:
- Debugging becomes easier (you see where transformations go wrong)
- Architecture choices make sense (you understand what each layer does)
- Learning algorithms feel natural (gradient descent is just rolling downhill)
- Research papers become readable (the math describes pictures)
Let's build that visual foundation.
Vectors: The Building Blocks
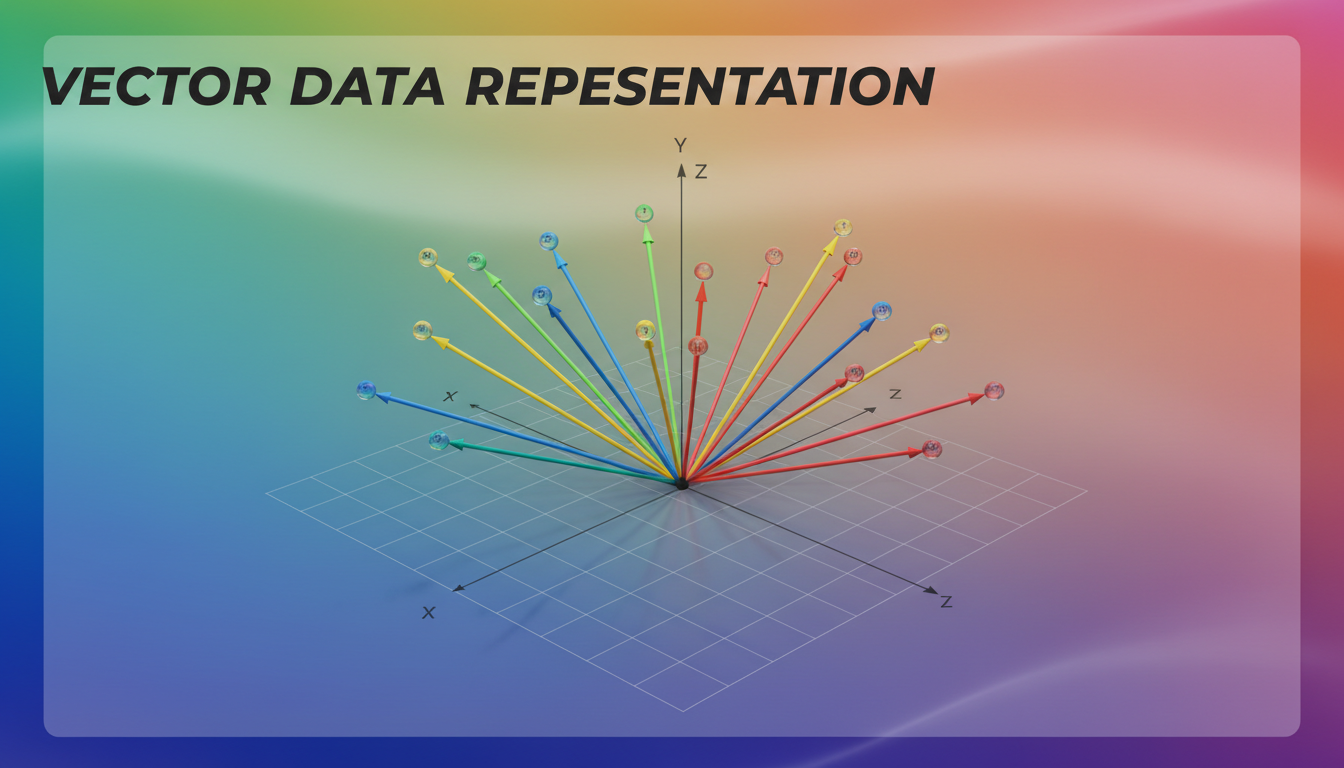 Vectors as arrows in space - each data point becomes a direction and magnitude
Everything in ML starts with vectors. But what is a vector, really?
The Two Ways to Think About Vectors
As a list of numbers:
v = [3, 4]
As an arrow in space: An arrow from the origin (0,0) to the point (3, 4). It has direction and length.
The second visualization is more powerful. It lets you see:
- Addition: Vectors as journeys. Walk one direction, then another.
- Scaling: Stretching or shrinking the arrow.
- Dot product: How much two arrows point in the same direction.
Why This Matters for ML
Every data point is a vector. An image is a vector (pixel values). A sentence is a vector (embeddings). A user's preferences are a vector.
When you visualize data as points in high-dimensional space, clustering algorithms become obvious (points that are close together), classification becomes drawing boundaries, and similarity becomes measuring distances.
Matrices: Transformations of Space
Matrices are where most people get lost. They're not just tables of numbers. They're transformations.
The Geometric View
A matrix transforms one vector into another. Visually, it's like taking all of 2D space and:
- Rotating it
- Stretching it
- Squishing it
- Shearing it
- Any combination of the above
Identity matrix: Does nothing, space stays the same Rotation matrix: Rotates space around the origin Scaling matrix: Stretches or compresses along axes Projection matrix: Flattens space to lower dimensions
Matrix Multiplication as Sequential Transformations
When you multiply matrices A × B, you're applying B's transformation first, then A's. It's like composing functions: do this, then do that.
This is exactly what neural networks do. Each layer is a matrix (weights) that transforms the previous layer's output.
Eigenvectors and Eigenvalues
Eigen-stuff confuses everyone until you visualize it.
An eigenvector of a matrix is a direction that doesn't change when you apply the transformation. It might get stretched or flipped, but it stays on the same line.
The eigenvalue tells you how much stretching happens.
Why this matters for ML: Principal Component Analysis (PCA) finds eigenvectors of your data's covariance matrix. These are the directions of maximum variance, the most informative axes.
Gradients: Slopes in High Dimensions
Gradients drive all of machine learning training. Understanding them visually makes everything clearer.
In 2D: Simple Slope
For a function f(x), the derivative f'(x) tells you the slope at any point. Positive slope: function going up. Negative slope: function going down.
In 3D: Direction of Steepest Climb
For a function f(x, y), the gradient is a 2D vector pointing in the direction of steepest ascent. Its magnitude tells you how steep.
If you're standing on a hill, the gradient points directly uphill.
In High Dimensions: Same Idea
For a function of 1000 variables, the gradient is a 1000-dimensional vector. Each component tells you: "If I nudge this input slightly, how does the output change?"
Free ComfyUI Workflows
Find free, open-source ComfyUI workflows for techniques in this article. Open source is strong.
Gradient Descent Visualization
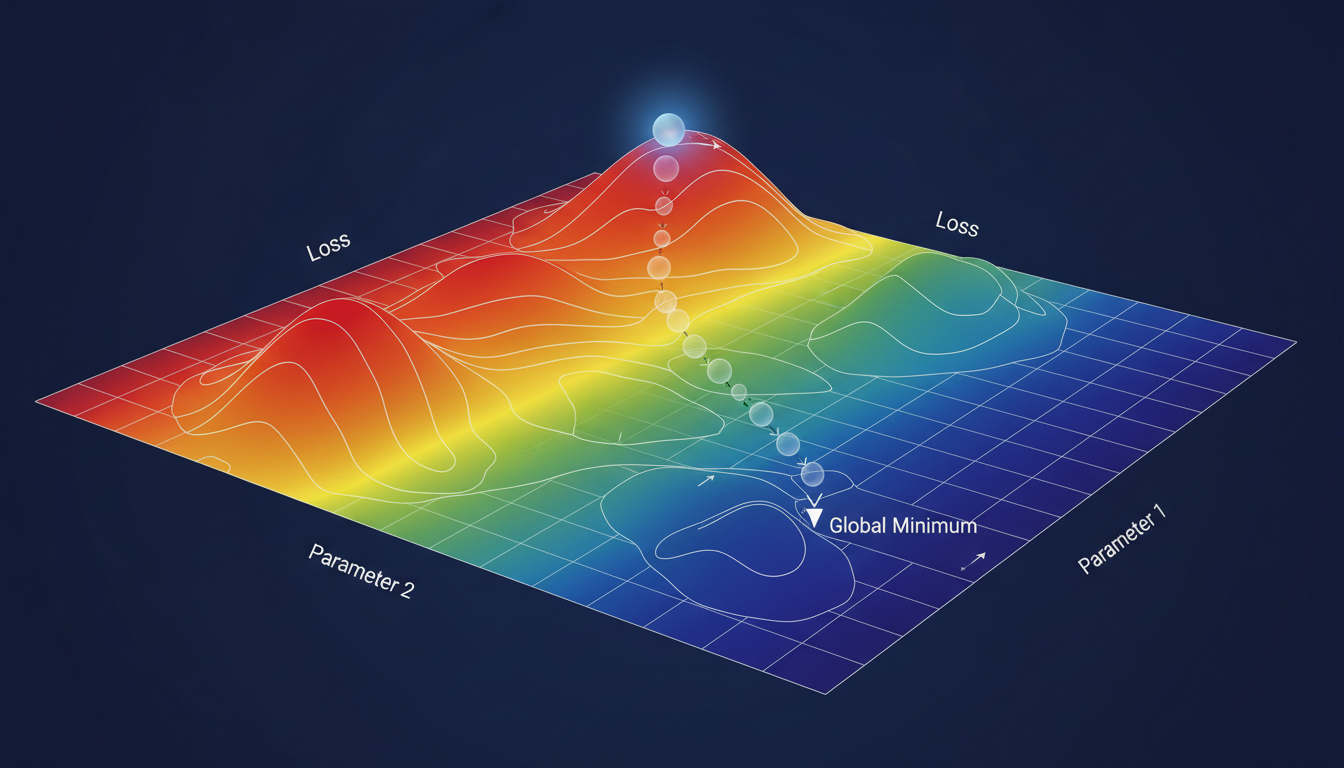 Gradient descent visualized as rolling downhill on the loss landscape
Training a neural network is gradient descent:
- You're on a high-dimensional surface (loss landscape)
- You want to find the lowest point (minimum loss)
- Compute the gradient (direction uphill)
- Step in the opposite direction (go downhill)
- Repeat until you reach a valley
That's it. All the sophisticated optimizers (Adam, SGD with momentum, etc.) are just clever ways to step downhill without overshooting or getting stuck.
Neural Networks: Layered Transformations
Now let's put it together for neural networks.
A Single Neuron
One neuron does:
- Take inputs as a vector
- Compute weighted sum (dot product with weights)
- Add bias
- Apply activation function
Geometrically, the weighted sum is projecting the input onto a line. The activation function adds a style or squash to that line.
A Layer
A layer is many neurons in parallel. Each neuron projects the input onto a different line. Together, they transform the input vector into a new space.
The weight matrix of a layer is exactly like the transformation matrices we discussed. It rotates, scales, and transforms the input space.
The Whole Network
A full network is these transformations stacked:
Input → Linear Transform → Nonlinearity → Linear Transform → Nonlinearity → ... → Output
Visually, you're taking your data and progressively warping the space until the patterns you care about become separable.
Why Depth Matters
A single layer can only do linear transformations (plus a simple activation style). Deep networks can compose many transformations, allowing them to create complex boundaries and patterns.
Want to skip the complexity? Apatero gives you professional AI results instantly with no technical setup required.
Think of it like origami. One fold can only do so much. Many folds create complexity.
Backpropagation: Gradient Flowing Backward
Training requires computing gradients with respect to every weight. Backpropagation does this efficiently.
The Chain Rule Visualized
If y depends on x, and z depends on y, then:
dz/dx = (dz/dy) × (dy/dx)
Geometrically: the sensitivity of z to x is the product of sensitivities along the path.
Backward Pass
- Compute forward pass (input → output)
- Compute loss (how wrong was the output?)
- Compute gradient of loss with respect to output
- For each layer (going backward):
- Multiply gradient by local derivative
- Pass result to previous layer
- Now you have gradients for all weights
Visualize it as gradient "flowing backward" through the network. Each layer receives gradient from the layer ahead and passes scaled gradient to the layer behind.
Why Gradients Vanish or Explode
If each layer multiplies the gradient by a number less than 1, gradients shrink exponentially (vanishing).
If each layer multiplies by more than 1, gradients grow exponentially (exploding).
This is why architecture choices (residual connections, normalization) matter. They control how gradients flow.
Practical Applications of Visual Intuition
Understanding Attention Mechanisms
Attention (in Transformers) is computing similarity between vectors. Visualize it as: "How aligned is this query with each key?" The more aligned, the more that value contributes to the output.
Self-attention lets each token "look at" every other token. The attention weights form a matrix showing which tokens attend to which.
Earn Up To $1,250+/Month Creating Content
Join our exclusive creator affiliate program. Get paid per viral video based on performance. Create content in your style with full creative freedom.
Understanding Embeddings
Embeddings place discrete items (words, users, products) into continuous vector space. Similar items are near each other.
Visualize word embeddings in 2D (using t-SNE or UMAP): you'll see clusters of similar words, and directions that encode relationships (king - man + woman ≈ queen).
Understanding Loss Landscapes
Your loss function creates a surface in weight-space. Training is navigating this surface.
Visualization shows:
- Smooth regions (easy optimization)
- Sharp valleys (sensitive to step size)
- Saddle points (flat in some directions)
- Local minima (good solutions, maybe not best)
Debugging Models
When something goes wrong, visualize:
- Activation distributions (are they saturating?)
- Gradient magnitudes (vanishing? exploding?)
- Weight distributions (are they staying reasonable?)
- Intermediate representations (is the data transforming as expected?)
Resources for Visual Learning
3Blue1Brown
Grant Sanderson's YouTube channel is the gold standard. His "Essence of Linear Algebra" and "Neural Networks" series are essential viewing for visual learners.
Deep Learning by Goodfellow et al.
The textbook has excellent diagrams throughout. The visual explanations of architectures are particularly good.
Seeing Theory
An interactive visualization of probability and statistics concepts. Useful for understanding distributions and sampling.
Distill.pub
Online journal specifically for clear, visual explanations of ML concepts. Every article is beautifully illustrated.
Tensorflow Playground
Interactive neural network visualization. See how networks learn to classify as you adjust parameters.
Building Your Own Visualizations
For your own understanding, create visualizations of:
- Data transformations: Plot your data before and after each layer
- Gradient flow: Visualize gradient magnitudes through your network
- Loss curves: Plot training and validation loss over time
- Embedding spaces: Project high-dimensional embeddings to 2D
Tools like matplotlib, plotly, and tensorboard make this straightforward.
Frequently Asked Questions
Do I need to be good at math for ML?
You need to understand the concepts, not compute integrals by hand. Visual intuition often matters more than algebraic manipulation.
What math should I learn first?
Linear algebra (vectors, matrices, transformations), then calculus (derivatives, gradients), then probability. All with visual emphasis.
How do I visualize high-dimensional spaces?
You can't directly visualize 100 dimensions. Instead, project to 2D (t-SNE, UMAP, PCA), visualize statistics (histograms, distributions), or examine 2D slices.
Why do some papers use so much notation?
Dense notation is compact. Once you understand what it means visually, you can read it more fluidly. It's like learning to read musical notation.
How important is matrix calculus?
The rules are useful to know, but understanding what's happening geometrically is more important. You can always look up the formulas.
Can visual intuition replace rigorous math?
For application, often yes. For research that pushes boundaries, you eventually need both. Start visual, add rigor as needed.
What about statistics and probability?
Same approach. Visualize distributions as shapes, probabilities as areas, expectations as centers of mass.
How do transformers work geometrically?
Attention is similarity computation (dot products). Transformers are alternating attention (mixing information) and feedforward (transforming each position). The residual connections maintain a "stream" that gets modified.
Why does batch normalization help?
It rescales and recenters activations, preventing distributions from drifting. Visualize it as keeping the data "well-shaped" for subsequent layers.
What's the intuition behind dropout?
Randomly zeroing neurons during training prevents co-adaptation. Visually, it's like forcing the network to learn multiple redundant representations.
Wrapping Up
Mathematics doesn't have to be a barrier to machine learning. When you visualize:
- Vectors are arrows
- Matrices are transformations
- Gradients are slopes
- Neural networks are layered space-warping
The formulas become meaningful. The architectures make sense. The debugging becomes intuitive.
Start with the visual intuition. Let the symbols come later. You'll find that understanding what the math does is more valuable than memorizing how to manipulate it.
Now go watch some 3Blue1Brown and see the math come alive.
Make AI images and video in your browser
Characters, video, photo packs. No GPU, no setup. Your first generation is free.